
Remember me
We screened 92 clinical kinase inhibitors (Supplementary Table 1 and Supplementary Fig. 1) across a panel of 758 kinases, including 409 wild-type kinases and 349 mutant kinases or kinase fusion products. Of the 92 inhibitors, 86 are FDA approved, one is approved by the National Medical Products Administration and five are in late-stage clinical trials. Of the approved drugs, two have since been discontinued and three have been withdrawn from the market. This screen used the HotSpot radiometric filter-binding kinase assay, a functional approach that directly quantifies the kinase-mediated transfer of a radiolabeled phosphate from ATP to a relevant protein or peptide substrate. Each HotSpot assay is individually optimized, including enzyme titration, substrate titration, buffer pH and key components such as cofactors (for example, Mg2+ and Mn2+), activators (for example, Ca2+ and lipid activators), detergents and reducing agents (for example, DTT and TCEP) (Supplementary Table 2). Km values for kinase, substrate and ATP are determined to assess whether an inhibitor is substrate competitive, ATP competitive or allosteric. Substrate selection is based on available knowledge and prior validation. When known downstream substrates exist, the full protein or relevant peptide is used; if not, a representative substrate from the same kinase family is selected. Historically validated substrates are adopted when available and, if none meet these criteria, a previously unrecognized substrate is identified through screening against a proprietary peptide or protein library. Most kinases in our study are full-length proteins, except for receptor tyrosine kinases (TKs), for which cytosolic domains are commonly used (Supplementary Table 2 and Supplementary Fig. 2). Overall, the HotSpot assay approach provides a robust platform for evaluating kinase–inhibitor interactions across a broad spectrum of kinases. While activity-based assays are inherently less effective for kinases with low catalytic activity or for compounds targeting regulatory domains, the HotSpot format remains highly reliable and particularly well suited for detecting inhibitors that engage the ATP-binding pocket, making it a powerful tool for mechanistic and comparative kinase studies.
To select an appropriate screening concentration, we first performed ten-point dose–response assays for 61 approved or clinical-grade kinase inhibitors against 369 wild-type kinases, generating 225,090 measurements (Supplementary Table 3 and Supplementary Fig. 3). These data suggested that a concentration of 1 μM captures both primary and secondary kinase targets while maintaining meaningful selectivity. To objectively select a screening concentration, we analyzed multidose response data from 14 representative clinical-approved kinase inhibitors using two complementary statistical approaches. First, we determined the dose at which drugs consistently inhibit their intended targets without broadly activating off-target effects. To address this, we used a logistic generalized linear model (GLM) to estimate the probability that a given dose would inhibit on-target kinases versus off-target kinases (defining a hit as ≥70% inhibition). Conceptually, this functions like evaluating how the true-positive rate and false-positive rate change as dose increases. As expected, on-target inhibition rises at lower concentrations, while off-target inhibition increases later. The GLM showed that ~1 μM is the dose at which on-target inhibition reliably exceeds our prespecified threshold (≥70% probability) while off-target inhibition remains low (≤20% probability) (Supplementary Fig. 4a).
Second, for each inhibitor we modeled its dose–response curve to find the lowest concentration that achieves near-maximal inhibition, recognizing that potency varies across drugs. For each drug, we fit a mixed-effects dose–response model and calculated the minimal concentration achieving ≥98% of its predicted maximal inhibition, its plateau concentration. We then summarized these plateau values across compounds using an empirical cumulative distribution function (ECDF). We found that 75% of inhibitors reached their near-maximal effect by ~0.83 μM, demonstrating that 1 μM reliably achieves strong on-target inhibition for the majority of kinase inhibitors (Supplementary Fig. 4b). Together, these orthogonal modeling approaches, GLM analysis of on-target versus off-target inhibition probability and mixed-effects saturation modeling summarized by ECDF support 1 μM as a selective, potent and broadly effective screening concentration.
Additional considerations further support this choice. First, 1 μM is widely used standard in kinase inhibitor profiling, including large-scale datasets such as Ambit/KINOMEscan, enabling direct cross-platform comparison. Second, it is sufficiently high to detect weak off-target interactions while minimizing nonspecific inhibition typical at supramicromolar concentrations. Third, this concentration approximates total plasma levels achieved by many FDA-approved kinase inhibitors (for example, dasatinib, ponatinib, sorafenib, sunitinib and imatinib) at therapeutic dosing14,15, underscoring the physiological relevance for meaningful target engagement. Importantly, our objective was not to model clinical exposure or toxicity but to establish a standardized biochemical reference map under consistent assay conditions. Accordingly, all compounds in the full panel were screened in duplicate at 1 μM with Km ATP, enabling detection of weak secondary targets and ensuring comparability across inhibitors. In total, we generated ~290,000 kinase–drug interaction measurements across 758 kinases (409 wild-type and 349 mutants; Supplementary Table 4), yielding an extensive and unbiased map of kinase–inhibitor selectivity and polypharmacology.
To assess reproducibility, we first compared biological replicates within our dataset, KiRHub. Percentage inhibition values for 92 clinical kinase inhibitors profiled across 758 kinases showed exceptionally high agreement (R2 = 0.99), demonstrating excellent assay precision and technical robustness (Supplementary Fig. 5a). We next evaluated concordance with previously published HotSpot radiometric assay data generated on the same biochemical platform. Comparison of 12 clinical kinase inhibitors previously profiled at 0.5 μM against 298 kinases9 revealed a strong correlation (r = 0.87), with radar plot overlays confirming close agreement in target-engagement profiles (Supplementary Figs. 5b and 6). As expected, screening at 1 μM in KiRHub dataset captured a broader target spectrum, consistent with dose-dependent kinase engagement. A second independent comparison of 11 inhibitors tested against 21 kinases at the same 0.5 μM reported an even higher correlation (r = 0.98) with previously published HotSpot results13, providing further validation of assay reproducibility using external datasets (Supplementary Figs. 5c and 7).
To benchmark activity-based KiRHub data against binding-based platforms, we compared our measurements to Ambit/KINOMEscan, a phage-display probe competition assay performed without ATP or substrate. Using ten-point dose–response profiling for 11 FDA-approved kinase inhibitors across 218 kinases, we observed strong overall correlation (r = 0.77) (Supplementary Figs. 8a and 9). We then compared KiRHub half-maximal inhibitory concentration (IC50) values for 14 inhibitors across 99 kinases to cell-based, kinobead mass spectrometry data and observed moderate concordance (r = 0.59), consistent with differences in protein context, endogenous abundance and assay format (Supplementary Figs. 8b and 10). Similarly, orthogonal comparison to the cellular NanoBRET target-engagement assay showed high agreement, with r = 0.80 for dasatinib IC50 values and r = 0.76 for crizotinib residual activity at 1 μM (Supplementary Figs. 11 and 12), confirming cross-platform consistency between biochemical and live-cell measurements. Notably, in both NanoBRET and kinobead assays, a slight rightward shift in IC50 values was observed relative to KiRHub, indicating that higher apparent concentrations are required in cellular contexts, likely reflecting differences in intracellular ATP, protein binding and permeability. Lastly, comparison to Kinativ, a chemical-proteomics ATP probe workflow profiling endogenous kinases, also demonstrated strong correlation for ibrutinib across 156 kinases (r = 0.71) (Supplementary Fig. 8c), despite inherent methodological differences. Of note, Kinativ is no longer commercially available because of limited scalability. Together, these analyses demonstrate that KiRHub dataset shows strong concordance both with prior previously reported HotSpot biochemical datasets and with major orthogonal platforms, including phage-display and chemoproteomics-based assays. Importantly, while binding-based assays can detect nonproductive interactions that do not inhibit catalytic activity, the HotSpot approach directly measures enzyme function under physiological ATP conditions. Accordingly, KiRHub dataset offers a mechanistically grounded, activity-based reference map while maintaining high agreement with established platforms across shared targets. With >290,000 kinase–drug interaction measurements spanning 92 clinical kinase inhibitors and 758 kinases (409 wild-type, 349 oncogenic variants), this represents the largest functional kinase inhibitor dataset to date, providing a rigorous biochemical resource for kinase drug selectivity and polypharmacology.
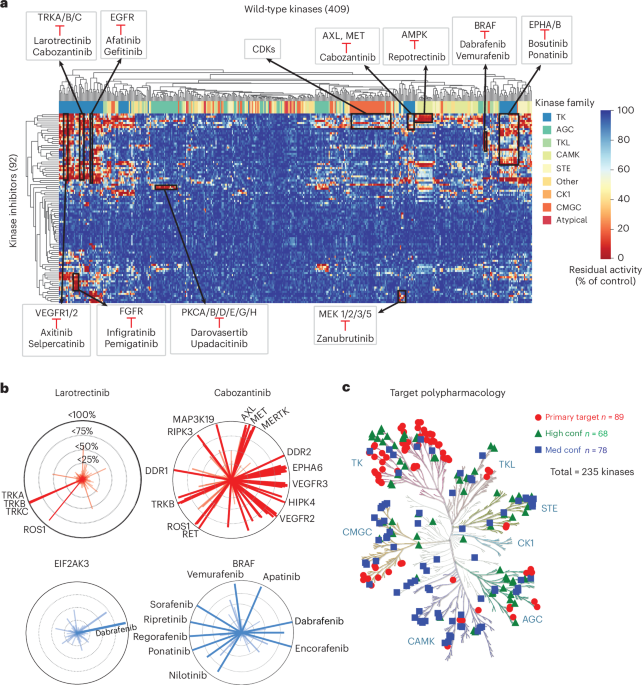
Kinome-wide clustering reveals conserved target selectivity and kinase family relationshipsHierarchical clustering of activity profiles from 92 clinical kinase inhibitors across 409 wild-type kinases revealed that kinases group on the basis of similarities in their inhibition patterns (Fig. 1a). Among the TK family, which is the target of 73% of the 86 FDA-approved inhibitors (Supplementary Fig. 1a), three major clusters emerged. One included VEGFR1/2, TRK, FGFR and EGFR subfamilies, another grouped EPHA/B kinases and the third included MET, AXL and MERTK kinases. Subfamilies consistently clustered together, reflecting their known inhibitor selectivity. For example, TRKA/B/C clustered with strong inhibition by larotrectinib and cabozantinib, VEGFR1/2 clustered with axitinib and selpercatinib and EGFR kinases clustered with afatinib. In the TKL family, BRAF was selectively inhibited by dabrafenib and vemurafenib. Repotrectinib inhibited AMPK (CAMK family), while PKC kinases (AGC family) were targeted by darovasertib and upadacitinib. Within the CMGC family, the largest cluster included CDK kinases, sharing sensitivity to several CDK inhibitors. Among STE kinases, MAP2Ks (MEK family) clustered together with known MEK inhibitor zanubrutinib, highlighting selective targeting across different levels of the MAPK pathway.
Fig. 1: Profiling the inhibition of 92 drugs across 409 kinases. The alternative text for this image may have been generated using AI.
a, A heat map showing inhibition profiles for 409 wild-type kinases across 92 kinase inhibitors. Each row is a drug and each column a kinase, with a color gradient (red for higher inhibition, blue for lower inhibition) showing patterns of selectivity and highlighting drugs with broad or specific kinase inhibition. b, Top: radar plots displaying the inhibition profile of larotrectinib and cabozantinib, with each line representing a kinase and the radius indicating inhibition levels (up to 100%). Kinases inhibited >95% (TRKA, TRKB and TRKC) by larotrectinib are labeled. Bottom: radar plots showing the top inhibitory drugs for EIF2AK3 and BRAF, with each line representing a drug and yjr radius indicating inhibition percentage (up to 100%). Drugs with >90% inhibition are labeled. c, KinMap visualization of polypharmacology for 92 inhibitors across 235 kinase targets. Primary targets (n = 89) are shown as red circles. High-confidence secondary targets (n = 68), defined as those inhibited by clinical kinase inhibitors with a KISS score > 40, are shown as green triangles. Medium-confidence secondary targets (n = 78), with KISS scores < 40, are shown as blue squares.
Visualization of the wild-type kinase–drug interaction matrix by two-dimensional (2D) uniform manifold approximation and projection (UMAP) representation revealed some distinct clustering by sequence and structural similarity (Supplementary Fig. 13a). Although there were several kinases in all the families that were randomly distributed, subsets of many of the kinase families were clearly clustered together. These included clusters of the TK, AGC, CMGC, CAMK and CK1 families. Along with the hierarchical cluster results, these analyses indicated that our comprehensive dataset captures patterns of kinase similarities in terms of functional activity, inhibition by known kinase inhibitors and sequence homology.
To evaluate the relationship between the activity profiles of the inhibitors and their chemical structures, we compared clustering patterns using 2D UMAP representations based on kinase inhibition profiles and chemical fingerprints (Supplementary Fig. 13b). The 92 clinical kinase inhibitors formed distinct clusters in both maps, with several structural classes showing consistent grouping across the two analyses. For example, structurally similar EGFR inhibitors clustered closely in both activity-based and structure-based representations. In contrast, among FGFR inhibitors, only infigratinib and pemigatinib, both structurally similar, clustered together, while futibatinib, which has a distinct chemical structure, formed a separate cluster (Supplementary Fig. 13c). This pattern was also reflected in its unique inhibitory profile. Overall, the clustering of functional activity data showed strong concordance with the chemical similarities of the compounds, reinforcing the relationship between structure and biological activity.
To visualize the selectivity and promiscuity of the inhibitors across 409 wild-type kinases, we plotted each inhibitor on the basis of its level of kinase inhibition and each kinase on the basis of the degree of inhibition it received (Fig. 1b). As an example, TRK family inhibitors demonstrate distinct selectivity profiles. Larotrectinib shows high specificity, achieving >95% inhibition only against TRKA, TRKB and TRKC (Fig. 1b). In contrast, cabozantinib exhibits a much broader inhibitory profile, targeting multiple kinases with >95% inhibition, including TRKB, ROS1, RET, MET, MERTK and VEGFR family members. Indeed, the differential selectivity of these two inhibitors is known16,17, providing additional validation of our approach. This type of analysis allows clear differentiation between selective and promiscuous inhibitors. Kinase-specific radar plots offer another intuitive way to visualize drug–target interactions and their potencies. For instance, the BRAF radar plot shows >95% inhibition by known BRAF inhibitors such as sorafenib, regorafenib and vemurafenib, as well as by several broader-spectrum inhibitors such as ripretinib and ponatinib (Fig. 1b). In contrast, EIF2AK3 shows high-level inhibition only by dabrafenib (>95%). Together, these representative analyses highlight the power of the full dataset as a resource for exploring drug-repurposing opportunities and understanding kinase inhibitor polypharmacology.
Expanding the target landscape of clinically approved kinase inhibitorsTo evaluate the polypharmacology of clinical kinase inhibitors, we applied three different methods to score kinase selectivity. One of these is the KISS score, which we previously developed and reported18. The KISS score quantifies how selectively a kinase inhibitor engages its intended targets relative to its off-target effects. It is calculated as the difference between (1) the geometric mean percentage inhibition of the drug’s primary target kinases and (2) an integrated penalty (IP) that accounts for off-target activity. This penalty combines the average inhibition of all nonprimary kinases with a variance term that increases when inhibition is more broadly distributed. As a result, KISS scores range from positive values for highly selective inhibitors to negative values for broadly acting compounds. A score closer to 100 reflects strong selectivity, while scores below 40 indicate more promiscuous activity across multiple kinases. In this analysis of 92 clinical kinase inhibitors, KISS scores ranged from 18 to 95, with the TRK inhibitor larotrectinib having a KISS = 95, indicating the highest selectivity, and gilteritinib having a KISS = 18, indicating broad inhibition despite this compound being labeled as a selective inhibitor of FLT3 mutant kinase (Supplementary Fig. 14a and Supplementary Table 5). As shown by midostaurin with KISS = 23.7, an inhibitor with a score close to the threshold of 20 exhibits activity across more than half of the wild-type kinases tested. We also calculated the Gini coefficient, for which a value closer to 1 signifies greater selectivity and value closer to 0 indicates a broader inhibition profile19 (Supplementary Fig. 14b and Supplementary Table 5). In our dataset, Gini coefficients ranged from 0.79 (zanubrutinib) to 0.47 (pacritinib). Larotrectinib had a Gini coefficient of 0.75, consistent with its high KISS score. The CATDS score, with a range from 0 to 1 for low to high selectivity, also represents a measure of for scoring inhibitor selectivity8. In our dataset, CATDS scores ranged from 0.99 (remibrutinib) and 0.98 (larotrectinib) to 0.40 (defactinib) and 0.42 (pacritinib), which exhibited broader activity (Supplementary Fig. 14c and Supplementary Table 5). Notably, PI3K and mTOR inhibitors could not be evaluated because of the absence of lipid kinase activity in our profiling dataset. Together, these three selectivity metrics provide a consistent and complementary view of kinase inhibitor polypharmacology.
Given the broad polypharmacology of clinically approved kinase inhibitors, we explored whether this property could be leveraged to identify existing drugs that inhibit kinases beyond their primary targets. Currently, the 92 clinical kinase inhibitors are designed to target 89 primary kinases (Fig. 1c). By analyzing inhibitor selectivity and applying a KISS score threshold of 40, we identified an additional 146 kinases that can be inhibited by at least one existing clinical kinase inhibitor panel (Fig. 1c and Supplementary Table 6). Our analysis expands the landscape of druggable kinase targets from 89 to 235, indicating that many clinically approved inhibitors could be repurposed to target additional kinases beyond their original intended use. We explore in detail some of the opportunities for inhibitor repurposing, identifying combination therapies, discovering applications for paralogous kinases and overcoming drug resistance and we demonstrate how this dataset can be combined with other data.
Identifying FDA-approved inhibitors for IRAK1/4Among the IRAK subfamily, IRAK1/4 are serine/threonine kinases involved in Toll-like receptor and interleukin 1 signaling pathways that have crucial roles in regulating innate immunity and inflammation. These two kinases are implicated in the pathogenesis of cancers, including breast, brain, liver and head and neck, as well as in metabolic and inflammatory diseases20,21,22. However, there are no FDA-approved inhibitors for IRAK1/4 (ref. 23). Thus, given the therapeutic potential of IRAK inhibition, identifying an FDA-approved kinase inhibitor with high potency and selectivity against IRAK1/4 could provide a treatment strategy for cancer and inflammatory diseases. We identified encorafenib (97% inhibition) and tepotinib (72% inhibition) as effective inhibitors of IRAK1 and tepotinib (72% inhibition) and vandetanib (86% inhibition) as effective inhibitors of IRAK4 (Supplementary Table 4). To confirm direct target binding, we first performed NanoBRET target-engagement assay, which demonstrated submicromolar interaction of tepotinib with IRAK4 (Supplementary Fig. 15a). We then used cellular thermal shift assays (CETSAs) to assess intracellular protein stabilization upon ligand binding24,25; tepotinib produced clear thermal shifts for both IRAK4 and IRAK1 across cellular models (Supplementary Fig. 15b,c). Together, these orthogonal assays establish tepotinib as a strong candidate for repurposing (Fig. 2a).
Fig. 2: A comprehensive overview of kinase inhibitor specificity, polypharmacology and efficacy offers potential for drug repurposing. The alternative text for this image may have been generated using AI.
a, A radar plot showing the efficacy of tepotinib against IRAK1/4 kinases. b, A Kaplan–Meier plot of participants with glioblastoma from TCGA showing high IRAK1/4 expression is associated with significantly reduced survival with a log-rank test (P = 0.04). c, A dose–response validation of tepotinib in glioblastoma cell lines reveals sensitivity (n = 3 for GSC923, n = 5 for GSC23 and n = 4 for GBM wild type); error bars indicate the s.d. d, A volcano plot showing significant DEGs in GSC923 neurospheres treated with 1 µM tepotinib for 24 h. Downregulated genes are highlighted in blue, while upregulated genes are marked in red. Differential expression was assessed using a two-sided exact statistical test based on the negative binomial distribution, as implemented in edgeR, followed by Benjamini–Hochberg FDR correction (FDR < 0.05). A few specific genes are emphasized, indicating their notable significance. e, Plot showing changes in cholesterol efflux in GSC923 neurospheres treated with tepoitinib at indicated times. Bars represent the mean of three replicates; error bars represent the s.e.m. Statistical significance was determined using a two-tailed unpaired Student’s t-test. ***P < 0.0001 and **P = 0.002. f, Pathway enrichment analysis of genes in GSC923 neurospheres treated with tepotinib. Downregulated transcription factors and pathways include NF-κB signaling, SREBF2, steroid metabolism and cholesterol synthesis. Upregulated pathways include LXR signaling, hypoxia response, autophagy and cellular senescence. Enrichment against KEGG, GO and Reactome pathway libraries was assessed using a one-sided Fisher’s exact test. P values were adjusted for multiple comparisons using the Benjamini–Hochberg FDR method. Adjusted P values (FDR) were used to determine statistical significance. g, Tepotinib suppresses tumor growth in a glioma PDX model as a single agent. Each group consists of n = 6 in the vehicle group and n = 5 in the tepotinib-treated group. Statistical analyses were performed using a two-tailed unpaired Student’s t-test with Welch’s correction. Tests were conducted independently at each time point and no multiple-comparison correction was applied. Data are shown as the mean ± s.e.m. ***P < 0.005 and **P = 0.04. h, A schematic showing the mechanism of action of tepotinib as an IRAK1/4 inhibitor affecting cholesterol levels and inflammatory signals.
To further validate this, we chose to focus on gliomas, a class of brain malignancies without effective treatment strategy that exhibit an association between high IRAK1/4 expression and poor overall survival (Fig. 2b). To test the therapeutic potential of tepotinib in gliomas, we treated three different glioma models and observed a significant reduction in neurosphere growth (Fig. 2c). To gain mechanistic insight into the growth suppression mediated by tepotinib, we performed transcriptomic analysis showed that GSC923 neurospheres exposed to 1 µM tepotinib for 24 h had significant downregulation of 175 genes and upregulation of 172 genes (fold change > 2, P < 0.05) (Fig. 2d). Among the downregulated genes were OLIG1 and OLIG2, which are involved in oligodendrocyte development and glioblastoma growth, SLC15A2 and SLC16A1, which encode solute carriers, and ARC, an apoptosis repressor. Among the genes with upregulated expression, we found ABCA1 and ABCG1, encoding transporters that mediate cholesterol efflux26, and BNIP3 and BMF, both of which encode proteins that promote apoptosis27. These findings align with previous studies showing that IRAK1/4 inhibition by small interfering RNA enhances the expression of ABCA1 and ABCG1 (ref. 28). Similarly, we observed a significant, time-dependent increase in cholesterol levels in the medium following tepotinib treatment (Fig. 2e). Pathway and transcription factor enrichment analysis revealed decreased expression of genes regulated by the transcription factors NF-κB and SREBF2, as well as a reduction in expression of genes involved in cholesterol synthesis pathways (Fig. 2f). Conversely, genes regulated by liver X receptor (LXR) were increased, along with increased expression of genes involved in autophagy and senescence-related pathways. Lastly, we evaluated tepotinib’s efficacy in a patient-derived xenograft (PDX) model of high-IRAK1-expressing glioma. Our data demonstrated that tepotinib significantly reduces tumor growth in vivo (Fig. 2g). Thus, our data indicated that tepotinib is an effective inhibitor of glioblastoma growth with potential application as a therapeutic agent for gliomas with high IRAK1/4 abundance. Mechanistically, our results with the neurospheres indicated that the reduction in viability is related to altered cholesterol metabolism and enhanced apoptosis (Fig. 2h). Taken together, these findings highlight the potential of repurposing FDA-approved kinase inhibitors, such as tepotinib, to target IRAK1/4-driven tumors, providing a promising therapeutic strategy for gliomas that depend on cholesterol.
Harnessing kinase dependencies and polypharmacology to identify drug-repurposing opportunitiesTo identify kinases that are candidates for inhibition across cancers of multiple lineages, as well as kinases that are candidates for inhibition in cancers of specific lineages, we performed exploratory analyses using the DepMap portal, which maps genetic dependencies across cancer types(Supplementary Fig. 16a)29. We defined kinases as essential for cancer growth using a normalized z score < −0.5 in at least one cancer lineage. Using this criterion, we identified 373 kinases (73% of the kinome) as essential for cancer cell growth (Supplementary Fig. 16). Cancers of the lymphoid lineage had the highest number of essential kinases (177), followed by those of the lung lineage with 176 essential kinases (Supplementary Fig. 16b and Supplementary Table 7). Cancers of the adrenal gland lineage had the fewest essential kinases (43). Of the 373 cancer-essential kinases, 46 were essential in more than 25 lineages; thus, we considered these as ‘common’ essential kinases. In contrast, 251 kinases were essential in only 1–10 lineages, making them lineage-specific essential kinases (Supplementary Fig. 16c). The common essential kinases were found in each of the kinase families (Supplementary Fig. 16c). Examples of common essential kinases are CDK4 and CDK6, whereas JAK2 and ALK are examples of lineage-specific essential kinases, with JAK2 essential in acute myeloid leukemia (AML) and ALK in neuroblastoma (NB) (Supplementary Fig. 16d). The protein–protein interaction network revealed that common essential kinases are highly interconnected, supporting core cancer cell functions such as cell-cycle progression, mitosis and survival signaling (Supplementary Fig. 16e,f). This connectivity explains their broad essentiality, whereby disrupting one can impair proliferation, but also highlights potential resistance, as tumors may compensate through parallel pathways. For example, CDK4/6 inhibition may be bypassed through activation of CHEK1 or Wee1 as shown previously30,31. These findings underscore the therapeutic value of targeting network hubs and suggest that rational combinations will be needed to overcome compensatory resistance. Lineage-specific dependencies such as JAK2 in AML and ALK in neuroblastoma further support tailored, context-specific strategies.
We explored the overlap between kinase inhibitor activity and essential kinases identified in DepMap CRISPR screens to assess off-target therapeutic potential. Several FDA-approved drugs, including abemaciclib, axitinib, ceritinib and selpercatinib, showed strong activity against essential kinases beyond their primary targets (Supplementary Fig. 17a). For example, abemaciclib not only targets CDK4/6 but also inhibits CDC7 and MYT1, key regulators of cell-cycle progression. Axitinib, a VEGFR inhibitor, potently inhibited AURKA and AURKB, mitotic kinases essential in many cancer types. Given the role of Aurora kinases in stabilizing N-Myc in MYCN-amplified NB and alveolar rhabdomyosarcoma32, we hypothesized that axitinib might suppress N-Myc-driven neurblastoma growth. Indeed, axitinib showed cytotoxicity in IMR32 neuroblastoma cells (IC50 = 358 nM), closely aligned with Aurora kinase inhibitors alisertib (182 nM) and tozasertib (218 nM) (Supplementary Fig. 17b), consistent with a recent study that demonstrated axitinib’s antitumor effects in neuroblastoma model33. Mechanistically, axitinib also reduced N-Myc protein levels in SKNBE2 and IMR32 cells (Supplementary Fig. 17c). Together, these findings point to the potential therapeutic relevance of axitinib’s off-target inhibition of Aurora kinases in neuroblastoma and, more broadly, underscore how approved kinase inhibitors might be repurposed using polypharmacology, recognizing that additional evidence will be required. Overall, this analysis highlights the potential of leveraging CRISPR-based dependency mapping to identify both common and lineage-specific essential kinases.
Identifying FDA-approved kinase inhibitors to suppress cell plasticity and overcome drug resistanceCancer lethality typically results not only from growth of the primary tumor but from progression through metastasis, evasion from the immune system and resistance to therapy34. One key mechanism driving that contributes to these processes is epithelial–mesenchymal transition (EMT)35. Several kinases, such as TGFBR, AXL and MET, are known regulators of EMT across multiple cancers36. To systematically identify kinases associated with EMT, we analyzed kinase expression in 234 mesenchymal-like and 263 epithelial-like cancer cell lines using CCLE data37 (Fig. 3a, Supplementary Table 8). Among the 60 kinases with high expression in mesenchymal-like cells were TGFBR1, AXL, DDR2, PDGFRA and PDGFRB; among the 32 kinases with high expression in epithelial-like cells were FGFR4, WNK2 and MST1R (Fig. 3a). Given the interconnected nature of EMT signaling38, inhibiting a single kinase may not be sufficient to fully suppress the EMT program. Therefore, FDA-approved kinase inhibitors capable of targeting multiple mesenchymal-associated kinases simultaneously could be a more effective therapeutic approach than inhibitors with high kinase selectivity to disrupt EMT-driven tumor progression, metastasis and drug resistance.
Fig. 3: Gilteritinib targets kinases specific to mesenchymal cancer cells and enhances sensitivity to MEK inhibition in breast cancer cells. The alternative text for this image may have been generated using AI.
a, Scatter plot of kinase expression in mesenchymal-like versus epithelial-like cell lines. Kinases upregulated in the epithelial-like cell lines (n = 32) are highlighted in red, while kinases upregulated in the mesenchymal subtype (n = 60) are shown in blue. b, Heat map showing the residual activity of 47 mesenchymal-specific kinases in response to 92 clinical kinase inhibitors. The color scale represents residual kinase activity levels. The top inhibitors, gilteritinib and pacritinib, which target most of the mesenchymal-specific kinases, are highlighted. c, Heat map showing the residual kinase activity of mesenchymal-specific kinases that are inhibited by gilteritinib and pacritinib. Selected kinases are also labeled. The color map follows the same scheme as in b. d, Western blot showing changes in the epithelial marker E-cadherin and mesenchymal markers vimentin and slug in response to 1 µM treatment of gilteritinib and pacritinib in MDA-MB-231 cells after 72 h. β-actin is shown as a loading control. The experiment was independently repeated at least twice with biological replicates, with similar results obtained. e, Gilteritinib upregulates CDH1 and downregulates VIM mRNA in MDA-MB-231 cells (n = three replicates; error bars denote the s.e.m.). CDH1, P = 8.35 × 10⁻⁵; VIM, P = 8.24 × 10⁻⁵ (two-tailed unpaired Student’s t-test). f, A volcano plot showing significant DEGs in MDA-MB-231 cells treated with 1 µM gilteritinib for 24 h. Downregulated genes (n = 198) are highlighted in blue; upregulated genes (n = 447) are marked in red. Differential expression was assessed using a two-sided exact statistical test based on the negative binomial distribution, as implemented in edgeR, followed by Benjamini–Hochberg FDR correction (FDR < 0.05). A few specific genes involved in EMT are indicated. g, Pathway enrichment of significantly downregulated genes in response to gilteritinib treatment. Enrichment against KEGG, GO and Reactome pathway libraries was assessed using a one-sided Fisher’s exact test. P values were adjusted for multiple comparisons using the Benjamini–Hochberg FDR method. Adjusted P values (FDR) were used to determine statistical significance. h, Gilteritinib treatment reduces cell migration in a dose-dependent manner (n = 3; error bars denote the s.e.m.). Cell migration was assessed using a wound-healing assay in a live-cell imaging system (Incucyte). i, Gilteritinib sensitizes breast cancer cells to MEK inhibition (n = 3; error bars denote the s.d.). Left, a dose–response curve of MDA-MB-231 cells treated with cobimetinib in the absence or presence of gilteritinib, with the respective EC50 values indicated. Right: heat maps showing that gilteritinib enhances the sensitivity of MDA-MB-231 and 4T1 breast cancer cells to both cobimetinib and trametinib.
Evaluation of the activity of 92 kinase inhibitors against 47 mesenchymal-associated kinases from our dataset identified gilteritinib, pacritinib and midostaurin as the most broadly active compounds (Fig. 3b and Supplementary Table 9). Gilteritinib inhibited 26 kinases, pacritinib inhibited 24 kinases and midostaurin inhibited 21 kinases, each achieving greater than 60% inhibition. Both gilteritinib and pacritinib showed strong inhibition of M1P4K4, AXL, ACVR1, NUAK1, FYN and CAMK2D and demonstrated partial inhibition of PDGFRA (Fig. 3c). Given the well-established heterogeneity and plasticity of EMT across tumor types and cellular contexts, we selected representative mesenchymal and EMT-plastic model systems to assess downstream effects, with the goal of providing proof of concept rather than implying uniform EMT regulation across all cancers. To test whether these inhibitors modulate the abundance of EMT-associated proteins, we selected to test MDA-MB-231 cells, a mesenchymal-like triple-negative breast cancer cell line39. Exposing the cells to pacritinib or gilteritinib for 24 h decreased the abundance of vimentin and slug, well-known markers of EMT40; however, only gilteritinib increased the abundance of E-cadherin, a key marker of epithelial-like cell states41 (Fig. 3d). Gilteritinib also increased mRNA expression of CDH1 (encoding E-cadherin) and reduced expression of VIM (encoding vimentin) (Fig. 3e). These results suggested that both inhibitors can suppress mesenchymal characteristics but only gilteritinib can induce a partial
Comments (0)